The complete sampling of the section, with ADCP monitoring.
Sample collection protocol.
Sampling carried out during HYBAM campaigns follows a sampling protocol at different depths, over several previously defined verticals. The sampling verticals are selected by an in situ analysis of the image provided by the ADCP concerning the intensity of the signal reflected by the suspended particles in the section, or “backscatter” (data unit: dB). This image (Figure 1) gives a fairly correct idea of the distribution of TSS in the section. In practice, 3 to 4 verticals have been defined per section, i.e. a positioning at about 25%, 50% and 75% of the section width in the first case, and at about 20%, 40%, 60% and 80% in the second case.
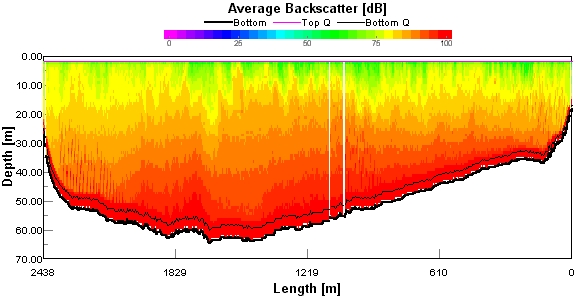 |
| Figure 1 : ADCP gauging: cross profile, and backscatter distribution in the section. Amazon river at Obidos, Brazil, 16/12/2003. |
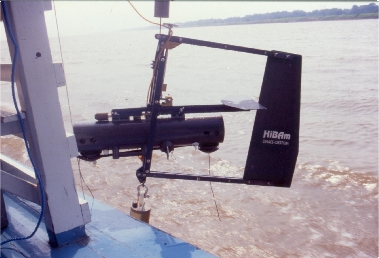
Two large capacity samplers (6 and 12 litres) were designed by the HYBAM program (Callède, 1994). These are oceanographic bottles installed on a horizontal profiled support specially designed to resist the high speeds (> 3 m/s) observed over the flooded Amazon (Figure 2). The sampler is positioned at the desired depth using an on-board electric winch equipped with a centimetre counter. The sampler closure is triggered by a “messenger” sliding on the sampler lift cable. Despite its own weight (60 Kg), a 120 Kg sounding weight is installed under the sampler for measurements in flood conditions.
During sampling, the boat’s position is controlled by GPS (Satellite Geopositioning System). The number and depth of sampling points are determined according to the backscatter image, with one point near the surface (at 1 m depth), and another as close as possible to the bottom of the section (usually 2 m from the bottom). This sampling depth is controlled by the centimeter counter on the sampler cable, while the total depth is controlled by the ADCP bathymetry signal, as well as by a conventional digital echo sounder installed on the boat. The intensity values (I) of the ADCP cells located near the sampled point are automatically extracted from the TRANSECT program files. This information is then compared with the results of the TSS measurements (Figure 5), in order to determine the TSS = f(I) type law.
 |
 |
| Figure 2 : Sampler ” Callède 2 “. | Figure 3: Passing the 12-litre sample through a 63 µm sieve. |
 |
|
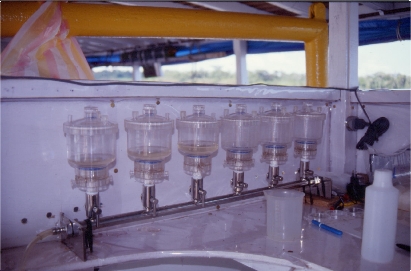
| Figure 4: Filtration ramp for determination of TSS (0.45 µm). | |
Filtration, sieving and weighing.
During the HYBAM field campaigns, very large numbers of samples were collected from various sections of the main rivers in the Amazon basin (Madeira, Negro, Solimões and Amazon rivers). To separate the sands from the finer TSS, the total sample (about 12 litres) was filtered through a 63 µm screen (Figure 3). The filtrate was then filtered through a 0.45 µm filter. Filtration was carried out on a SARTORIUS type ramp (6 units of 250 ml) connected to an electric vacuum pump. The filtration operation (Figure 4) was conducted in situ in a laboratory on board the boat during the mission. The drying and weighing of the filters was carried out in the laboratory of the Institute of Geosciences of the University of Brasilia (IG/UnB), Brazil. It should be noted that the sieving process (63µm) of the raw sample was not carried out during the first campaigns of 1995 and 1996.
Bibliographical referencies.
Callède J. 1994. Coletor de amostra d’água. Publ. HiBAm, Brasília, 16 p.
Filizola N. 2003. Transfert sédimentaire actuel par les fleuves amazoniens. Thèse de doctorat, Université P. Sabatier, Toulouse. 292 p.
Filizola N., Guyot J. L. (sous presse). Amazon river suspended sediment sampling and water discharge measurements at Obidos, Brazil, using an acoustic Doppler current profiler and traditional technologies. Hydrological Sciences Journal.
Guyot J.L., Filizola N., Guimarães V. 1998. Amazon suspended sediment yield measurements using an Acoustic Doppler Current Profiler (ADCP): First results, 109-115. In Hydrology in the Humid Tropic Environment, Kingston, November 1996, IAHS Publ. 253.
 |
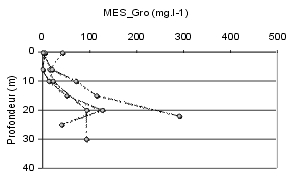 |
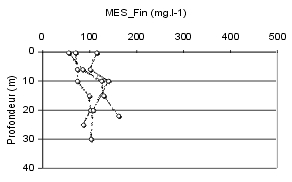
| a) Fine TSS vs. depth | b) Coarse TSS vs. depth |
 |
|
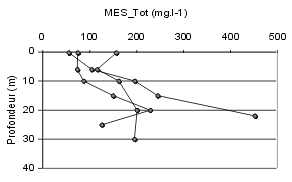
| c) Total TSS vs. depth | |
| Figure 5 Concentrations of TSS on 3 verticals – Solimões river at Manacapuru on 12/05/1997 | |