Display and consultation of the geographical representation of the measurement points.

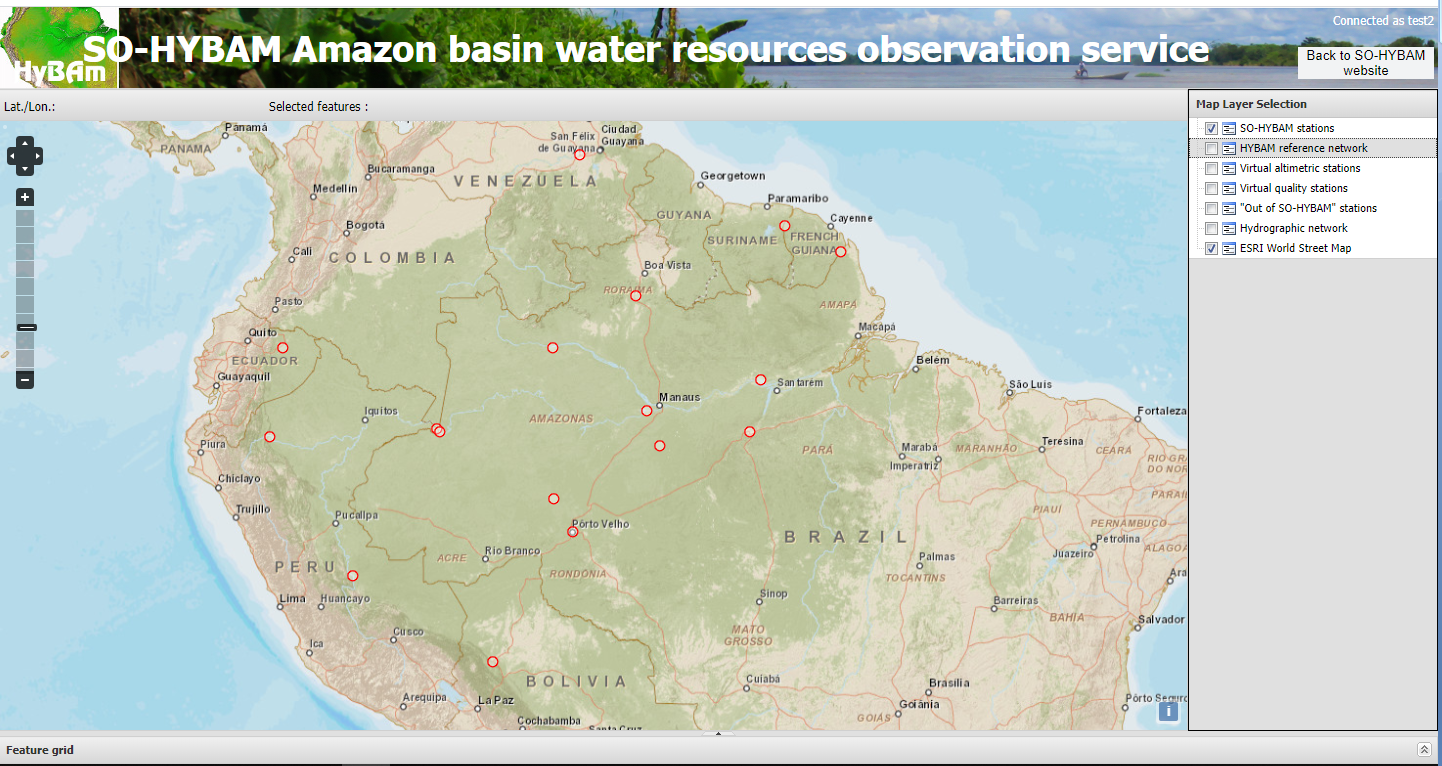
The consultation of the database made available by the SO-HYBAM site starts with a map display showing the stations of the SO-HYBAM stricto-sensu (figure 1).

On this interactive map, it is possible to change the represented area in two ways :

  • by moving with the mouse the cursor located between the + and – buttons to increase/decrease the zoom (the other functions of this navigation tool are inactive),
  • using the mouse wheel to increase/decrease the zoom,
  • by moving the mouse while holding down the left mouse button to move the region shown on the map, for example to access stations in the Congo Basin (figure 2).

Figure 1: Initial screen for data consultation (menu Data/Software/Data).


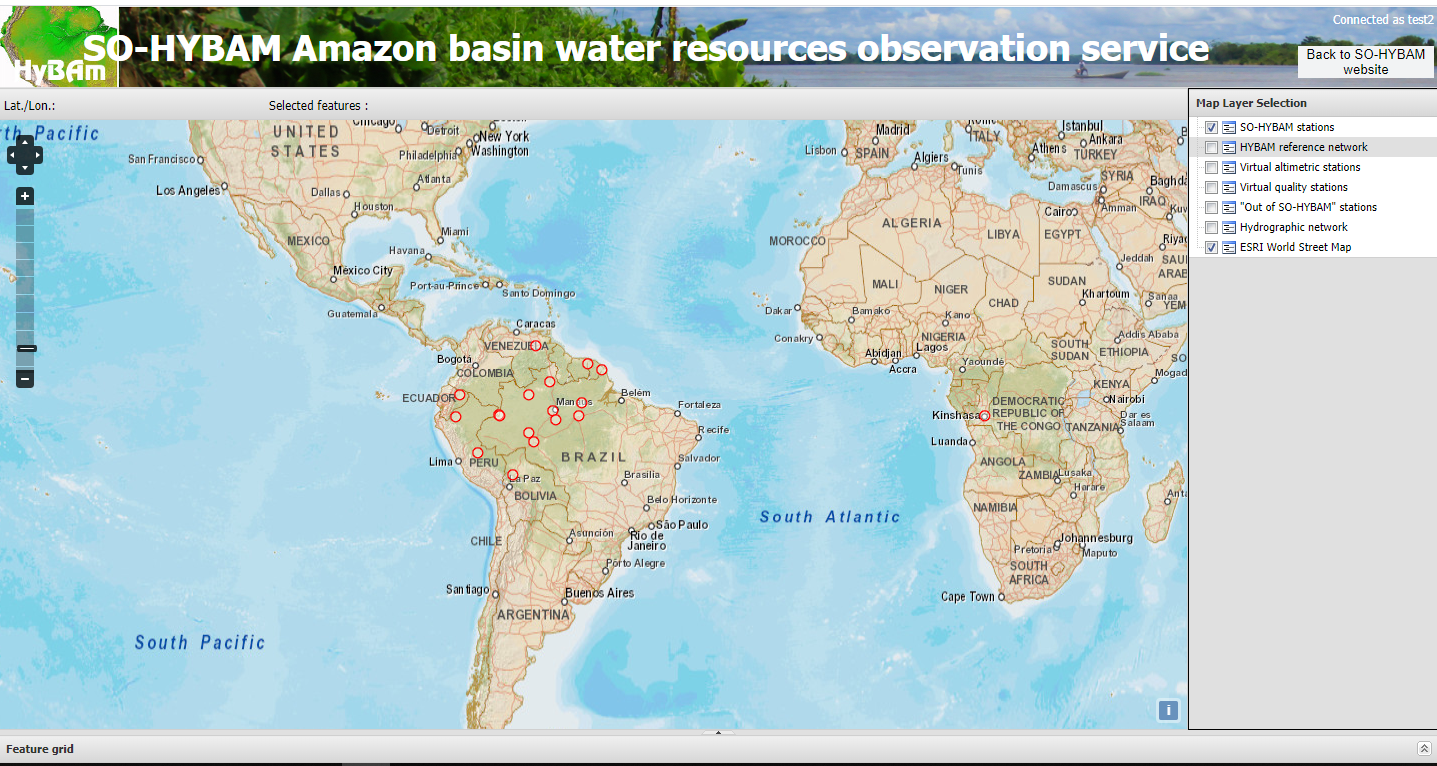
Figure 2: Map with extension to the Congo Basin.


Several sets of stations can be added/removed to this representation by selecting or not selecting the corresponding item in the menu at the top right of the map :

  • SO HYBAM stations : 15 stations of the SO HYBAM network stricto sensu, one station on the Orinoco river and one station on the Congo river;
  • HYBAM reference network: a network for monitoring the concentration of suspended solids that includes about twenty stations complementary to those of the SO HYBAM network (part of the data from this reference network is reserved for participants in projects associated with the SO-HYBAM observatory);
  • Virtual altimetric stations: an experimental network that uses altimeters from several satellites to form virtual limnimetric stations;
  • Virtual quality stations: an experimental network using MODIS (Terra/Aqua satellites) and VIIRS (Suomi satellite) sensors to build virtual stations for monitoring surface TSS concentration;
  • Measurement stations outside SO-HYBAM: other stations in national observation networks or measurement sites visited at least once during field campaigns;
  • Hydrographic network:


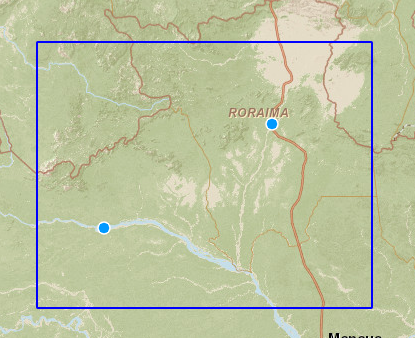
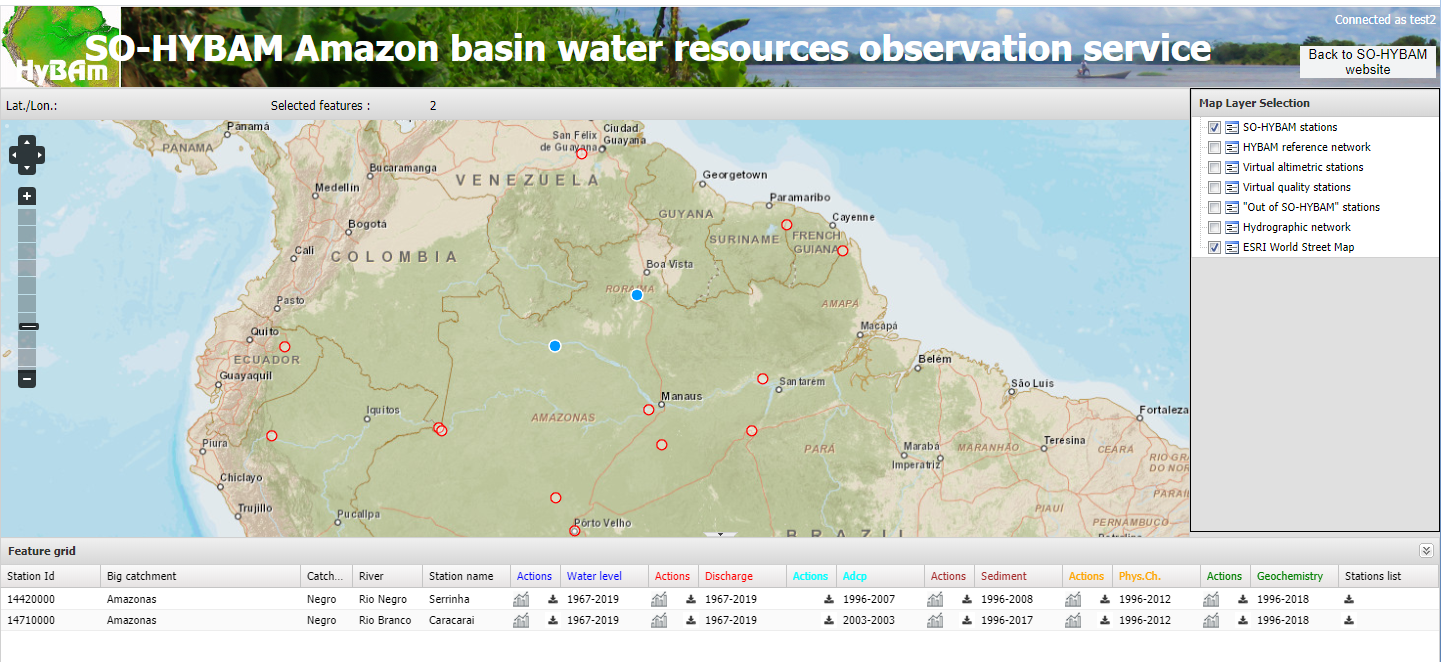
Selection of the measurement points whose data are to be consulted.

The selection of a single station can be made by clicking with the mouse on the symbol that represents a station. The choice of one or more stations can be made by drawing a rectangle, which envelops all the desired stations, with the mouse while holding down the Ctrl key on the keyboard (figure 3).

The selected stations are displayed in blue on the map and an inventory of the data available at these stations is displayed below the map in the form of a table (figure 4) with:

  • the station id,
  • the name of the large basin, sub-basin and river where the station is located,
  • 7 sets of columns that correspond to large types of data (ratings, liquid flow rates, Doppler flow measurements, surface TSS concentrations, physico-chemical parameters, geochemical concentrations (major elements, minor elements, rare earths and trace elements) with, for each:
    • the period for which data are available (there may be gaps),
    • a button  to display a graph of the data for all selected stations
    • a buttonto download data of the corresponding type, as an Excel file, for one or all of the selected stations.


Figure 3: Selection of several stations with the mouse.


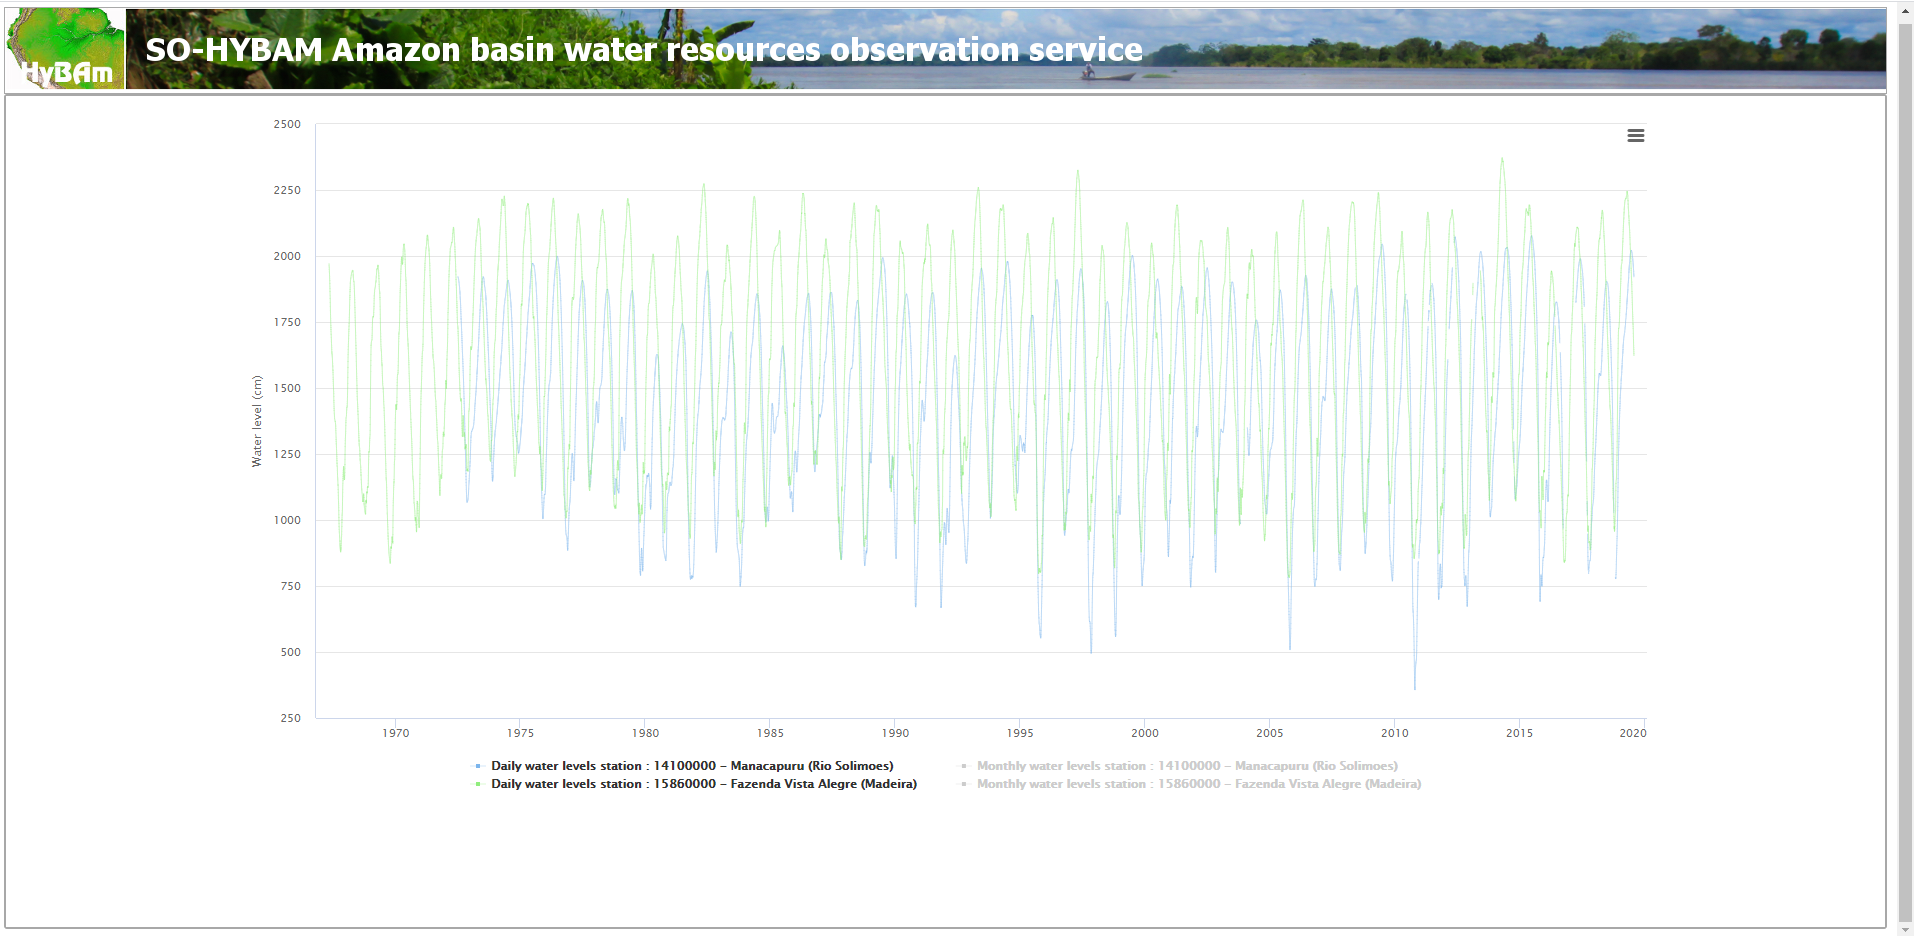
Figure 4. After selecting 2 stations (in blue), display of the data inventory table at these stations.

Plotting data for the selected stations ().

The data are plotted as time series covering the entire period available (figure 5). By default, daily and monthly data are shown for ratings and flows.

On the chart:

  • it is possible to hide/show each data series by clicking on the name of the series in the legend below the graph;
  • move the mouse to display the data corresponding to the position of the pointer on the time scale shown (figure 6);
  • zoom in by drawing a rectangle with the mouse, if you zoom in sufficiently, the points are displayed (figure 7);
  • a button allows to cancel the current zoom;
  • a menu makes it possible to export the graph in various formats:

Figure 5: Graphical representation of water levels at 2 selected stations.


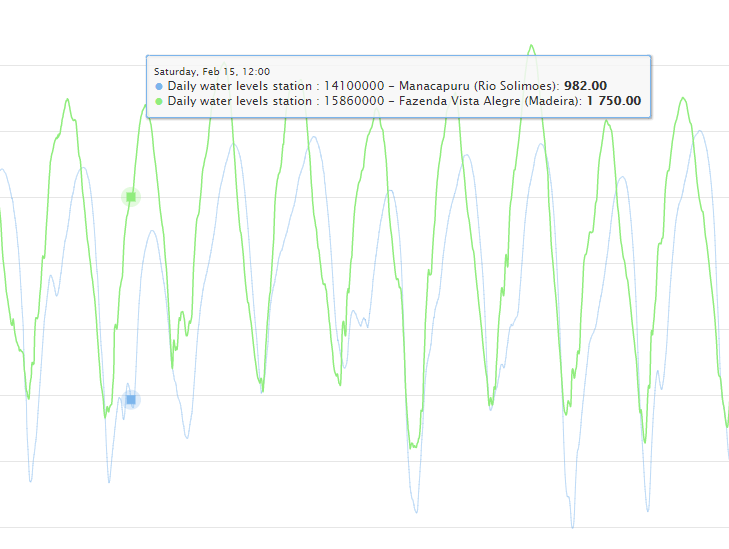
Figure 6. Displaying values at the position of the mouse pointer.


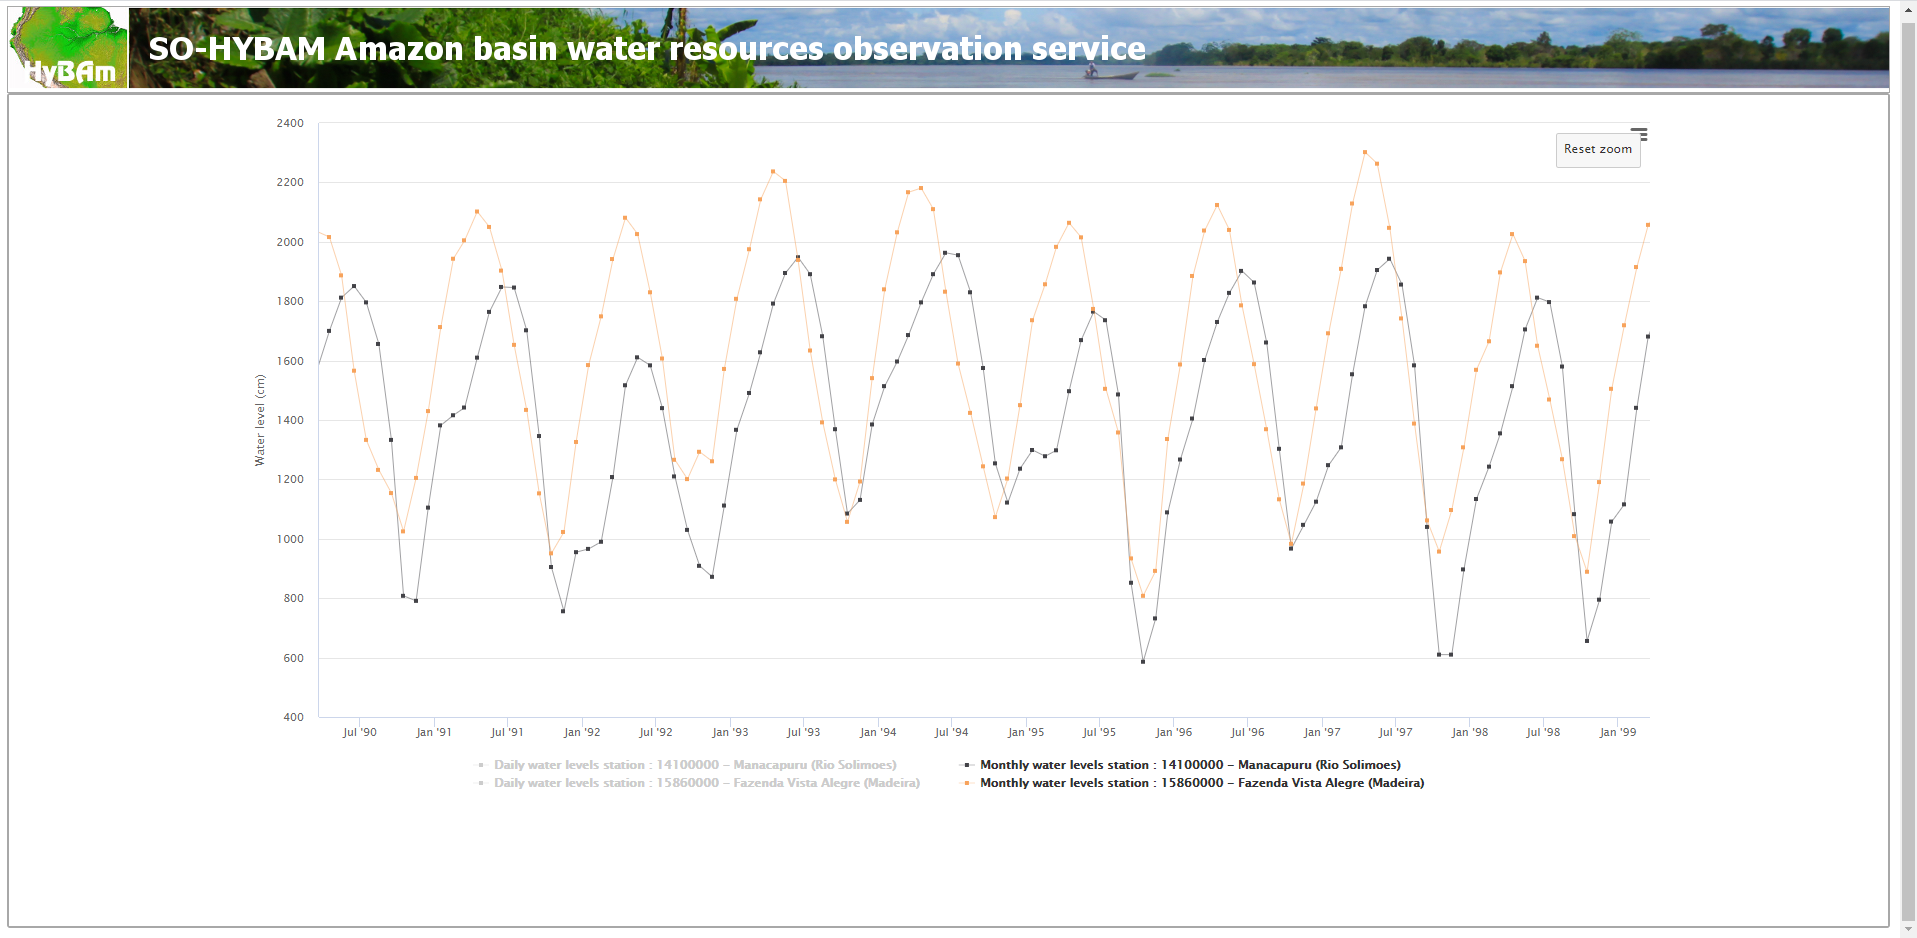
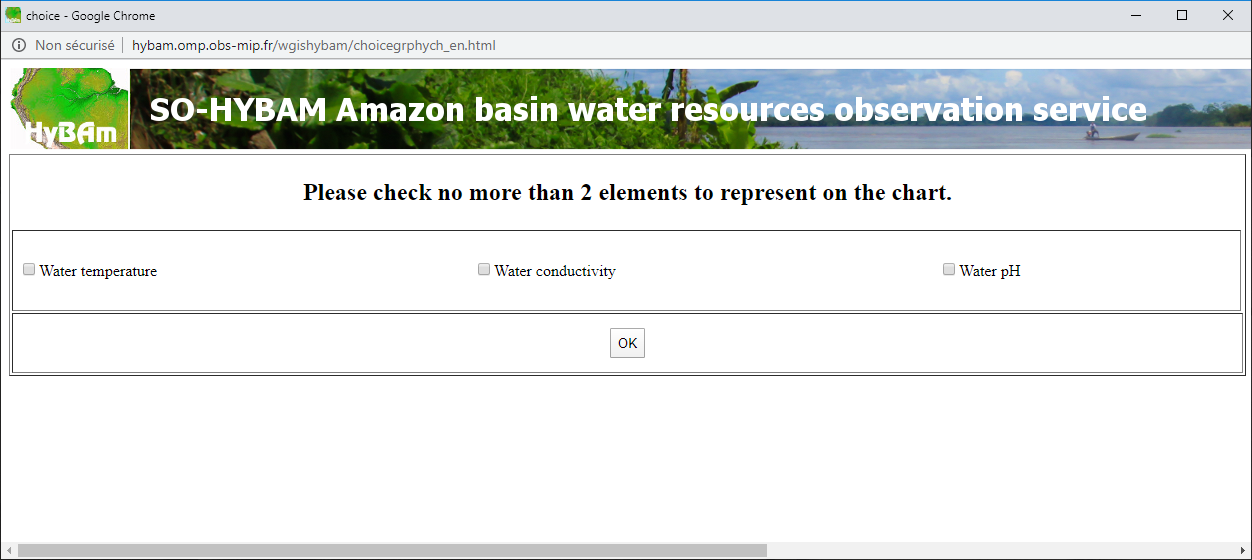
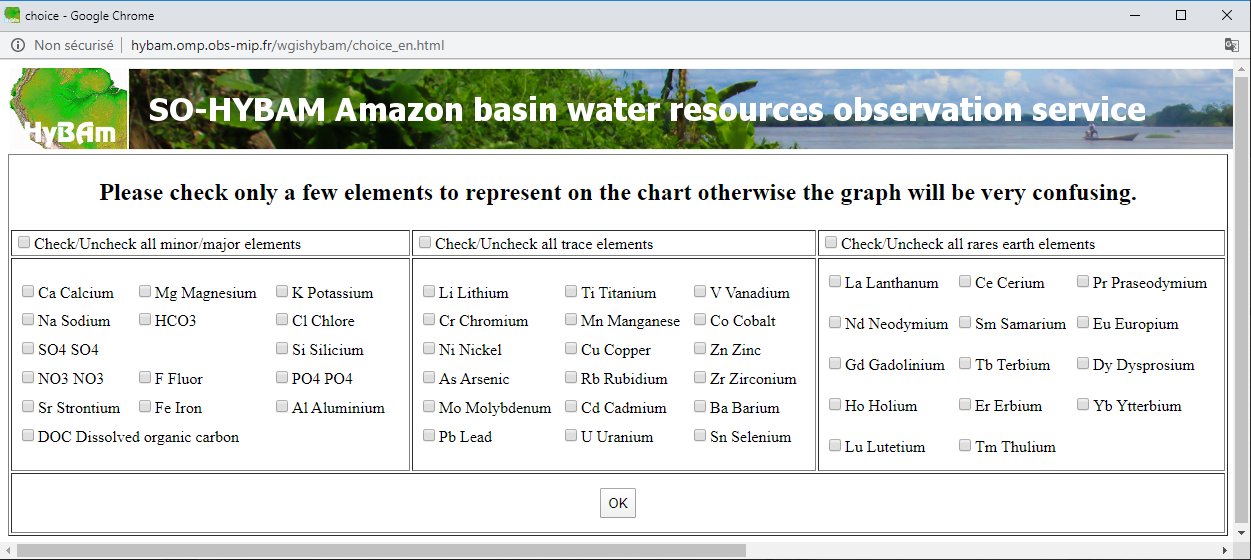
Figure 7. Graphical representation of water levels at 2 selected stations, after zooming in.

For some types of data that involve data with more than 2 different units of measurement or a large number of parameters it is possible to choose the series that will be represented on the graph. This is the case for physical chemistry data (figure 8) and geochemistry data (figure 9).


Figure 8. Selection of physico-chemical parameters to be represented graphically.


Figure 9. Selection of geochemical parameters to be represented graphically.


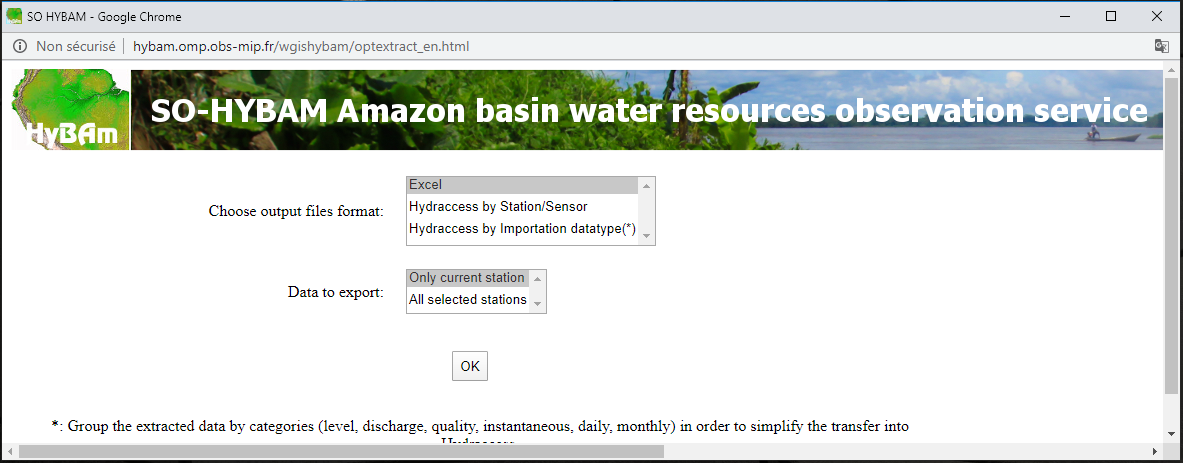
Data extraction and download for selected stations ()

These functions make it possible for the user to obtain in Excel or Hydraccess format the data contained in the database for the selected stations. For most data types it is possible to choose between (figure 10):

    • an output as an Excel file;
    • an extraction in a format recognized by the Hydraccess software (distributed on the Software page), a software for the management and processing of hydropluviometric data that allows to perform many processing operations.


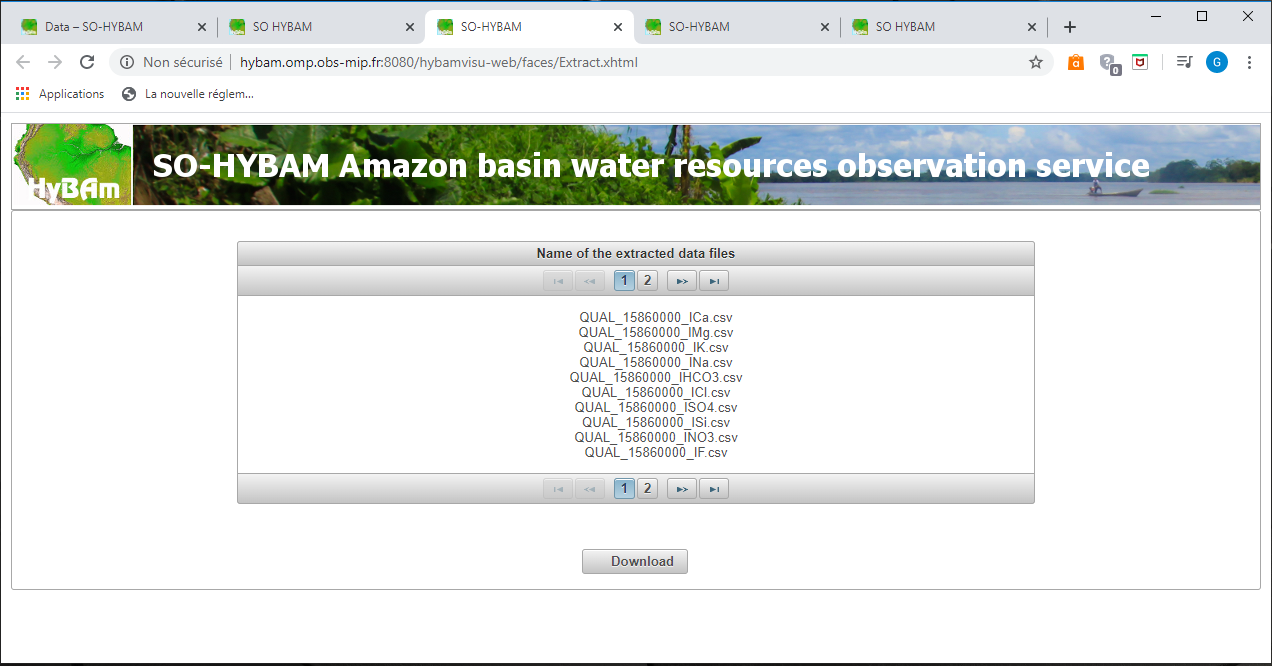
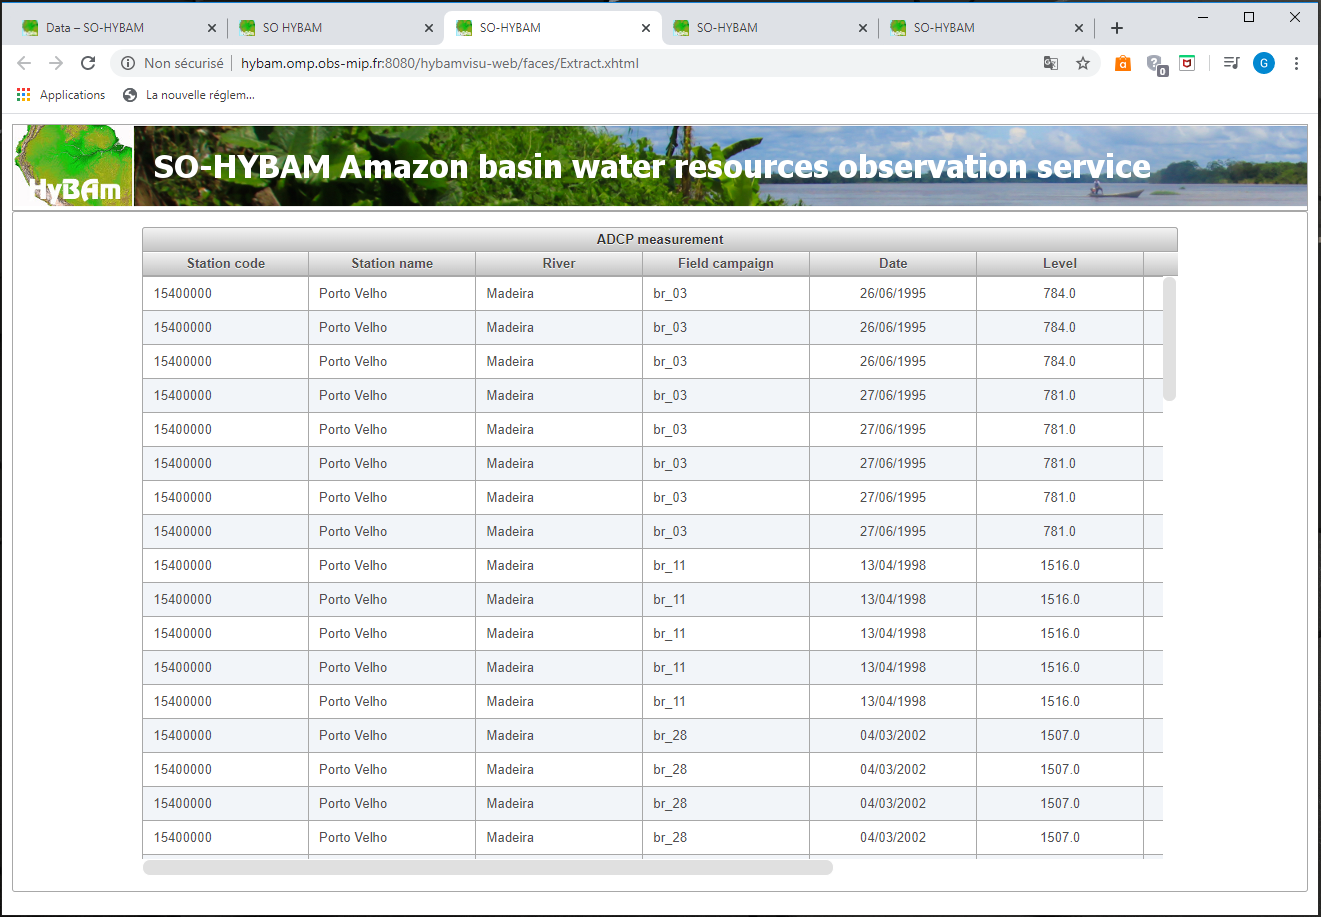
Figure 10. Selection of extraction parameters.

It is also possible to limit the extracted data to a single station (the one where the user pressed the button , called the current station) or to extract data from all stations in the inventory table (figure 4).

In the case of geochemistry and physico-chemistry it is also required to select the parameter(s) to be extracted.

A table summarizes the names of the created output files and the button makes it possible to download a compressed zip file with all extracted files. (figure 11).

In the case of flow measurements by ADCP, the first table displays the list of available ADCP gauges (figure 12) and a button makes it possible to download the raw files of the discharge measurement recognized by the software supplied with the ADCP hardware.


Figure 11. Extracted files ready for download.


Figure 12. Table of ADCP measurement files to download.